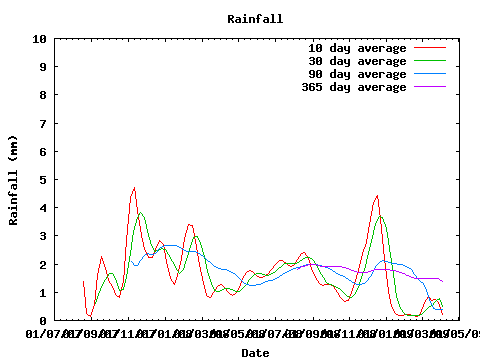
Since 8 August 2007 we have been measuring rainfall. I'm still trying
to find good ways to represent the statistics, but currently I have a graph that I update
from time to time showing smoothed statistics for 10, 30, 90 and 365 days:

Click on the image for a larger version. The graphs obviously have to start at different
places, since I first need to collect sufficient data to average.
The interesting thing here is that we actually have relatively good rainfall, about 650 mm
per year. The problems are the unevenness and the high evaporation rate, which exceeds the
rainfall.


