
| Greg's network link statistics |
|
||||||
|
|
|
|
|||||||||||
This page shows my network availability and performance statistics connected to the Australian National Broadband Network. It bases on earlier pages that I wrote for the DSL and satellite connections.
I had hoped that with the advent of the NBN, this page would no longer be needed. Unfortunately, this has proven not to be the case. While I don't have issues with throughput, the availability has been the worst I have ever experienced, with outages of up to 48 hours. It's not clear where the problem lies, but I have observed serious issues with the DHCP authentication that my ISP uses. More here when I understand the situation better.
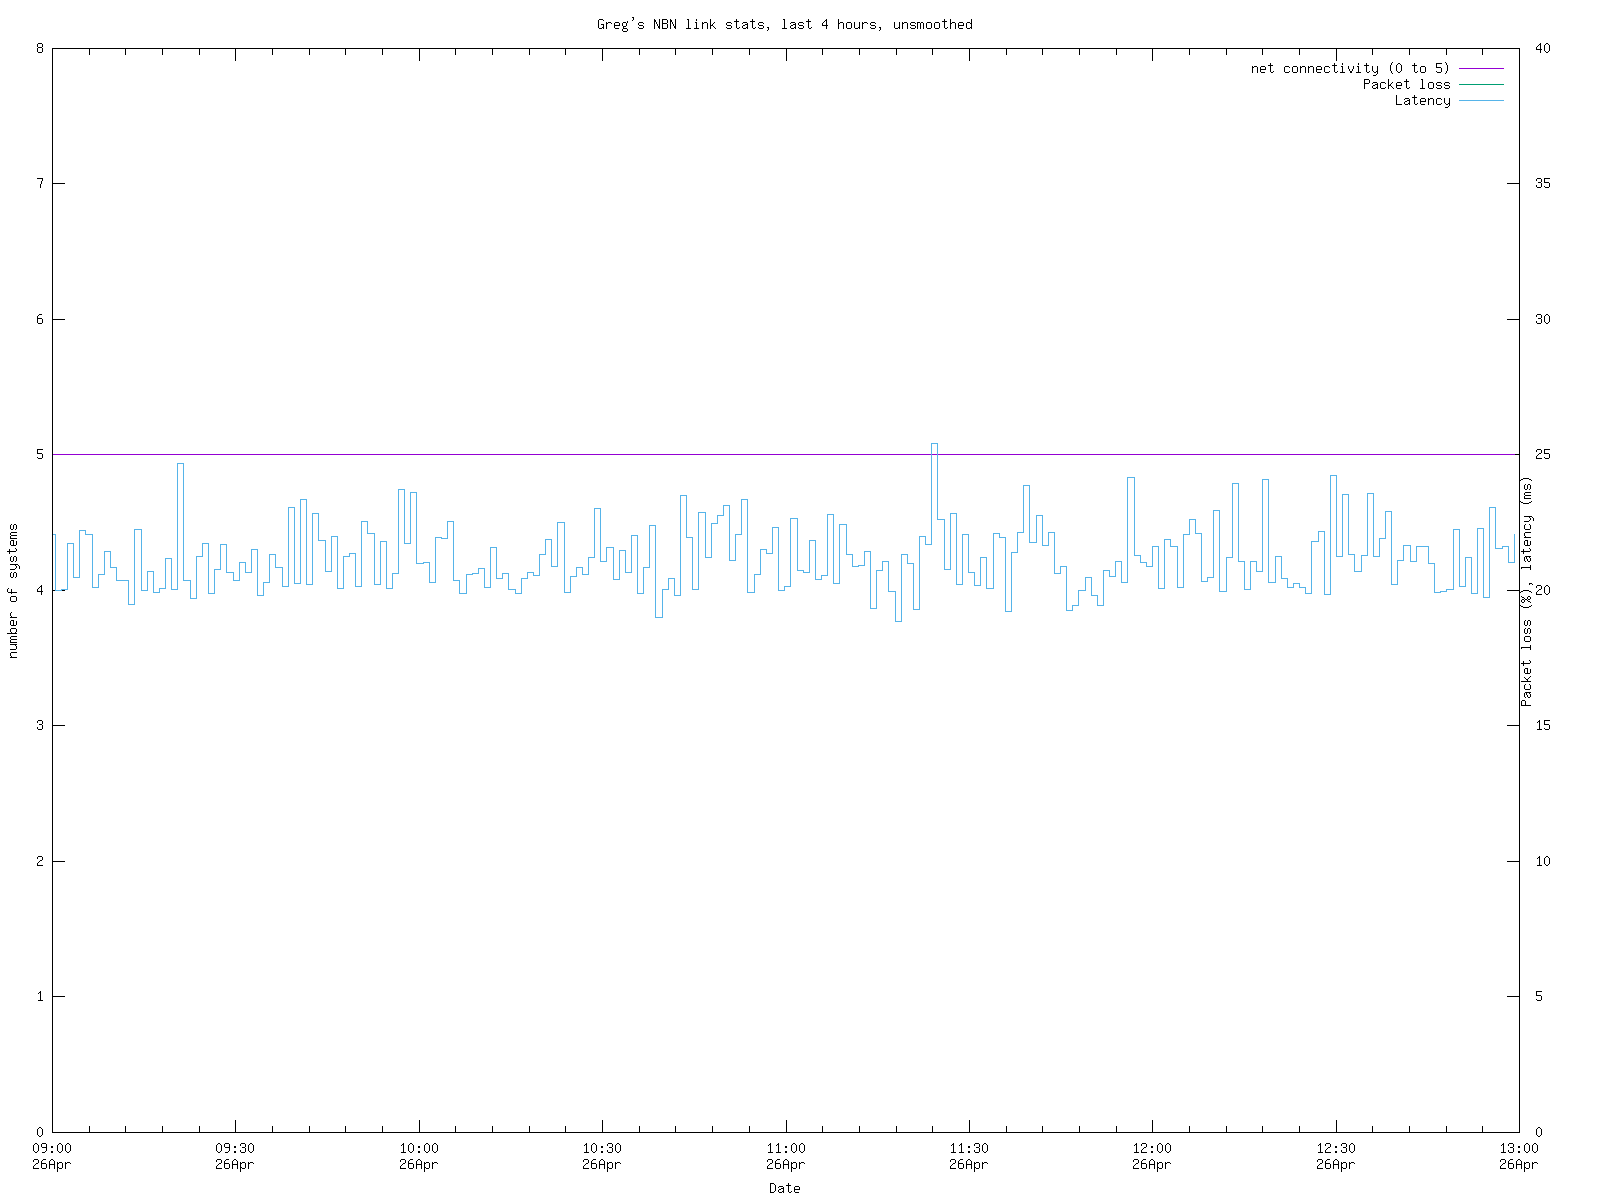
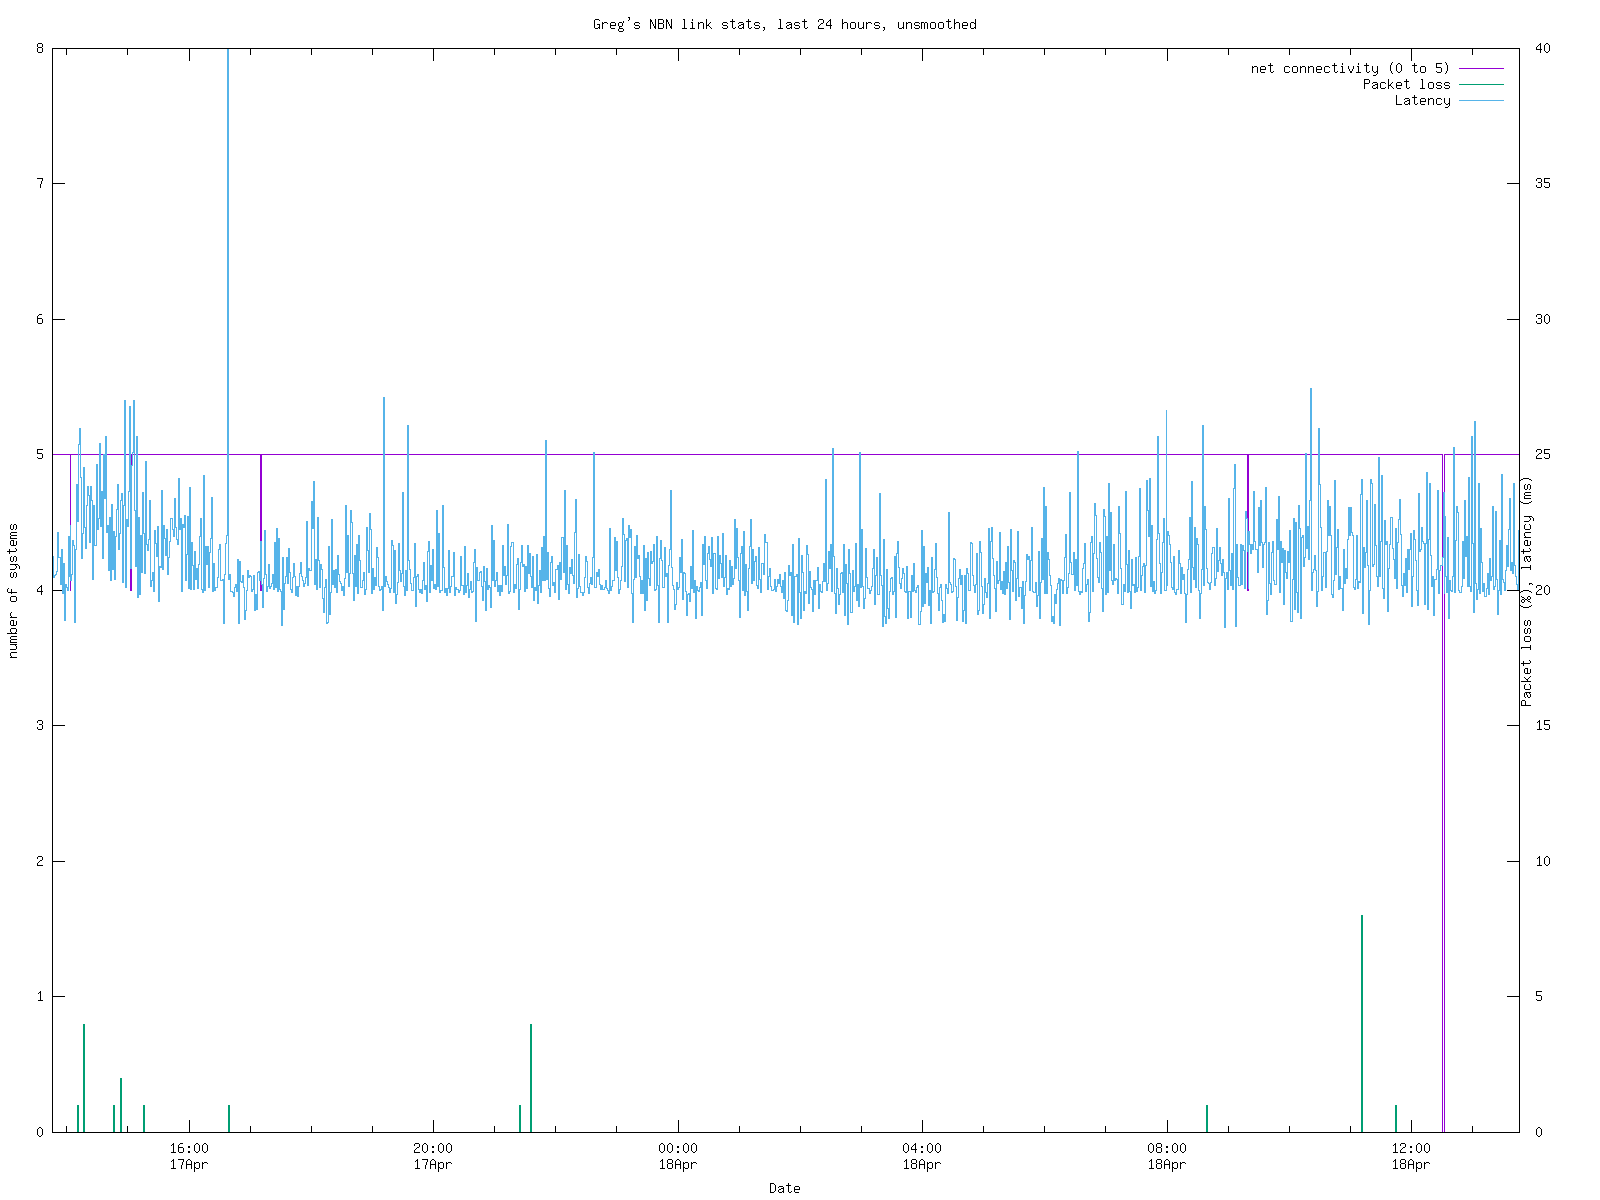
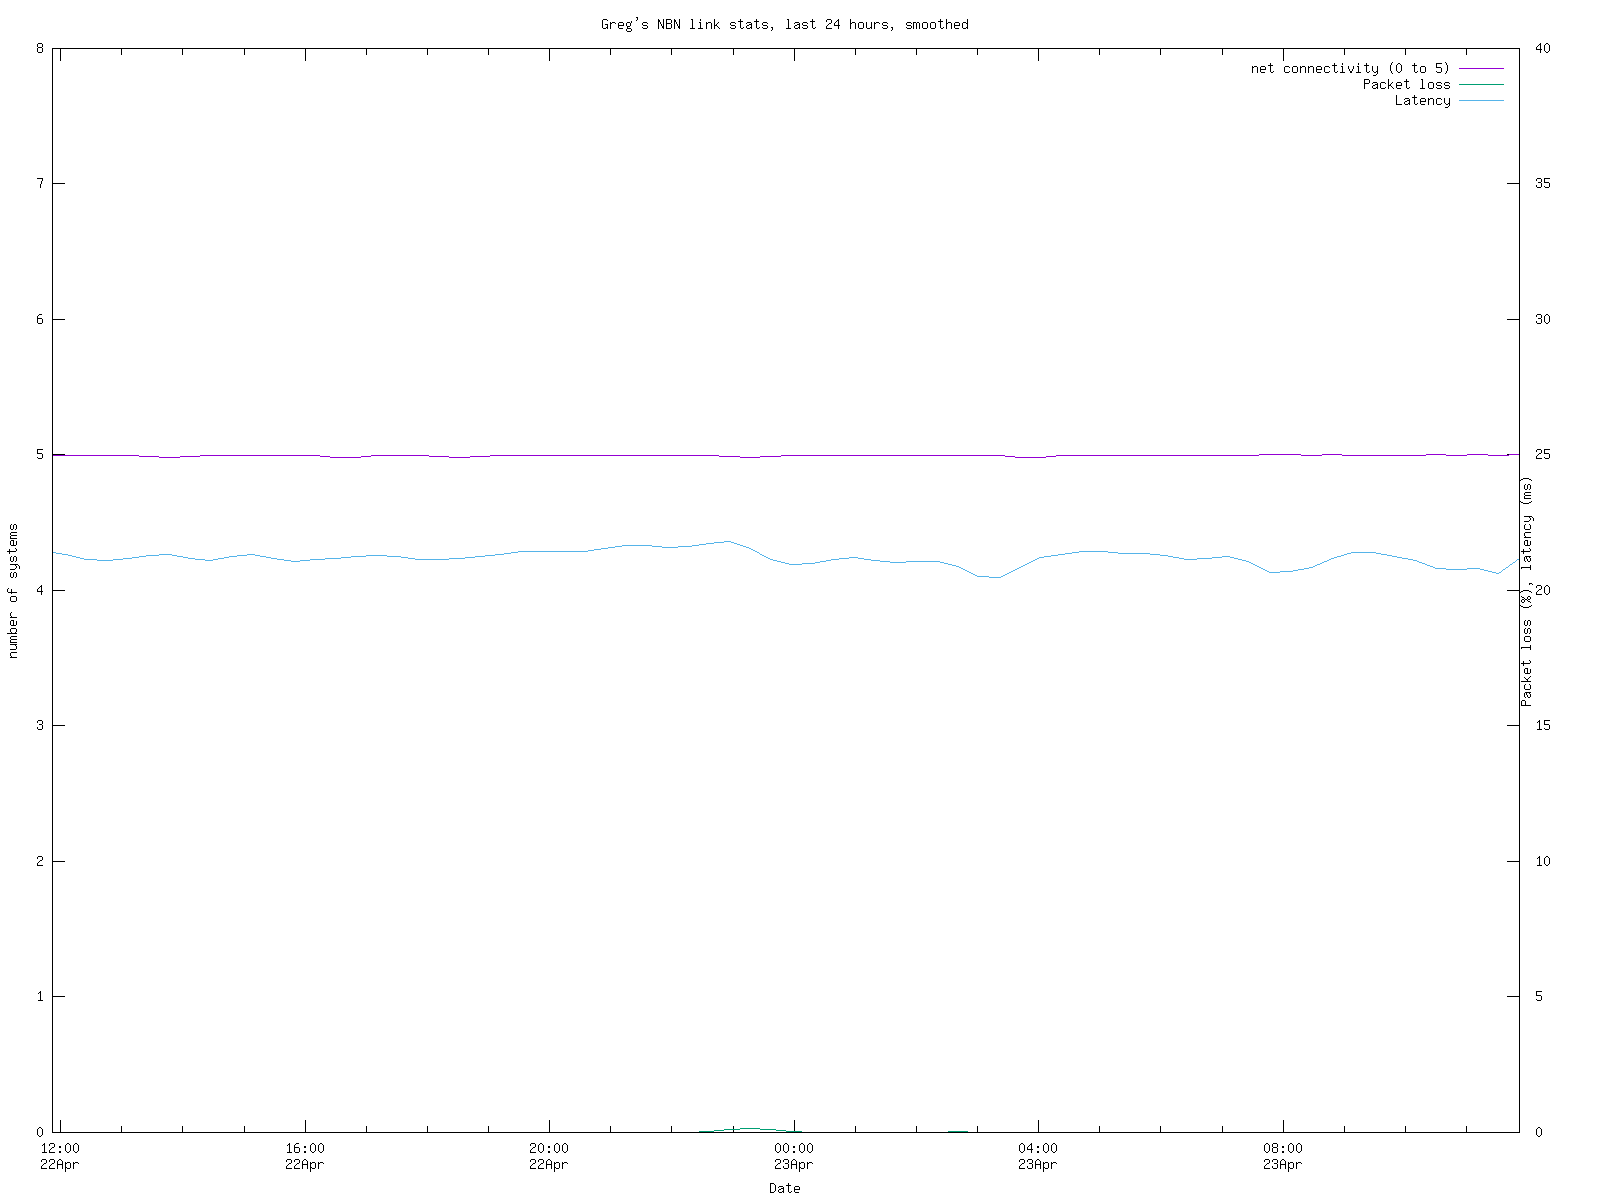
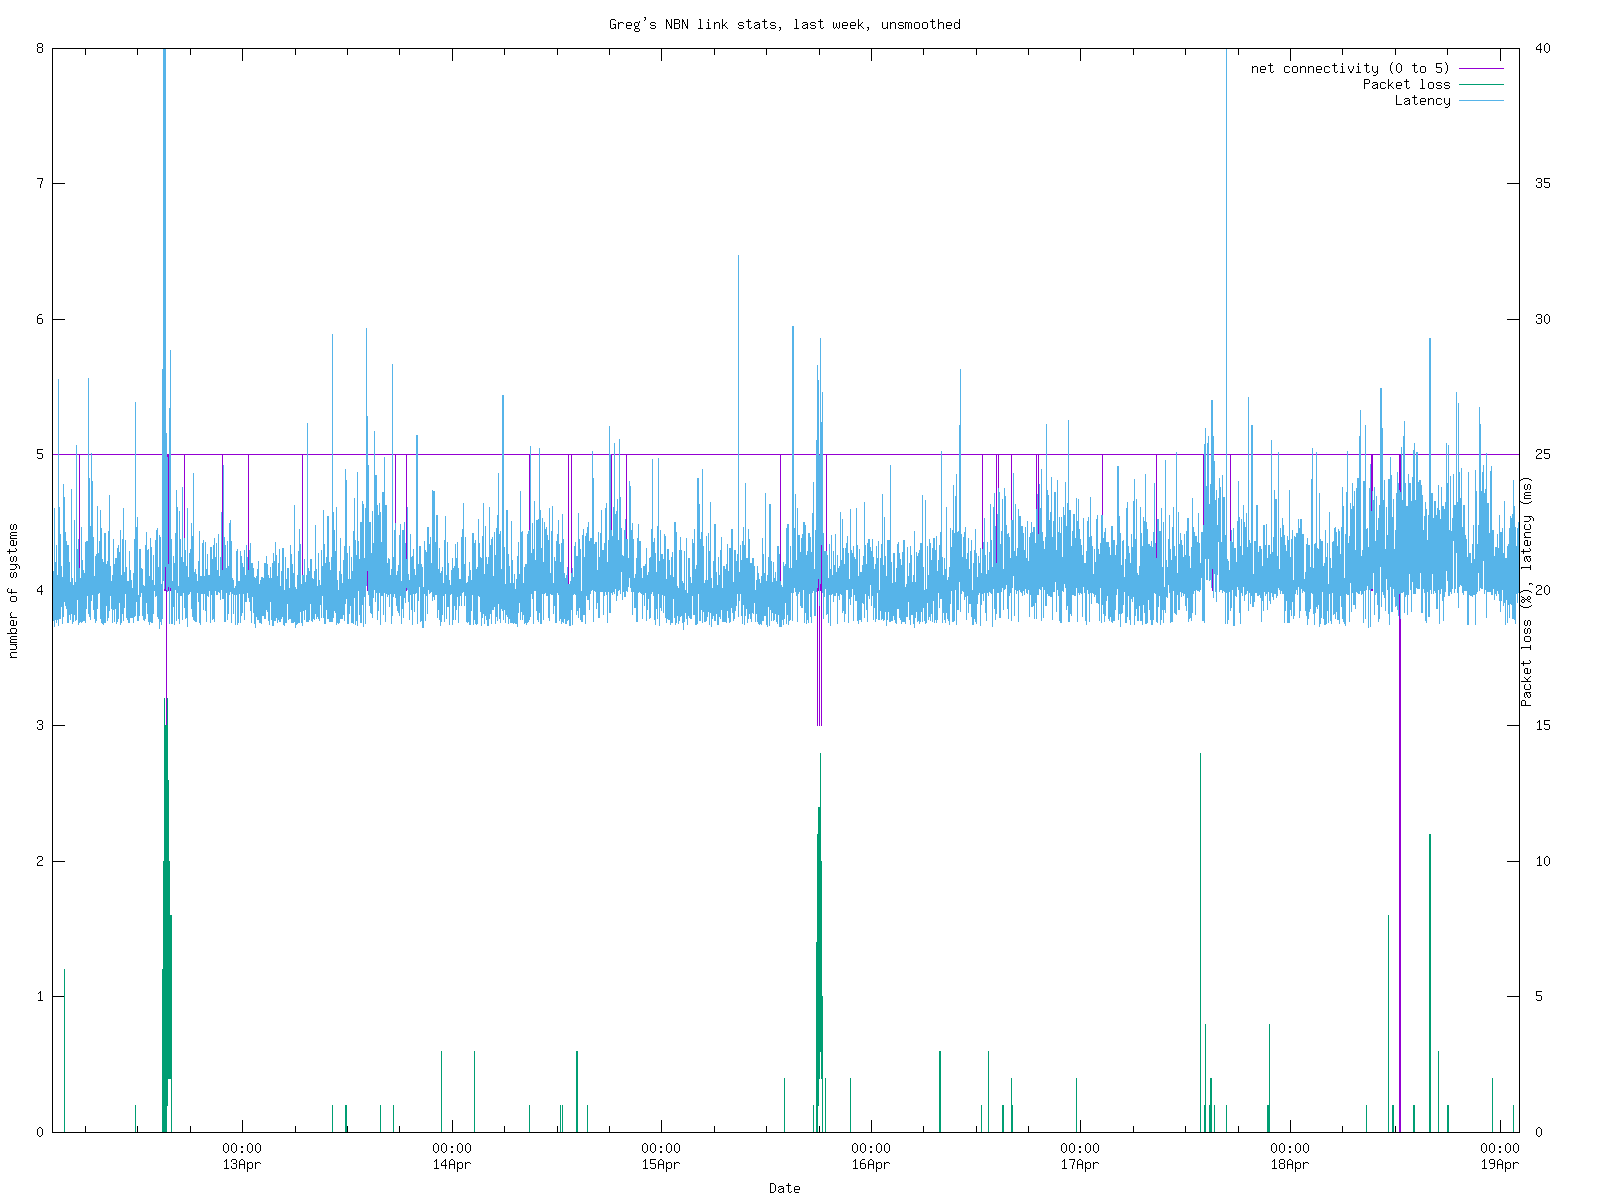
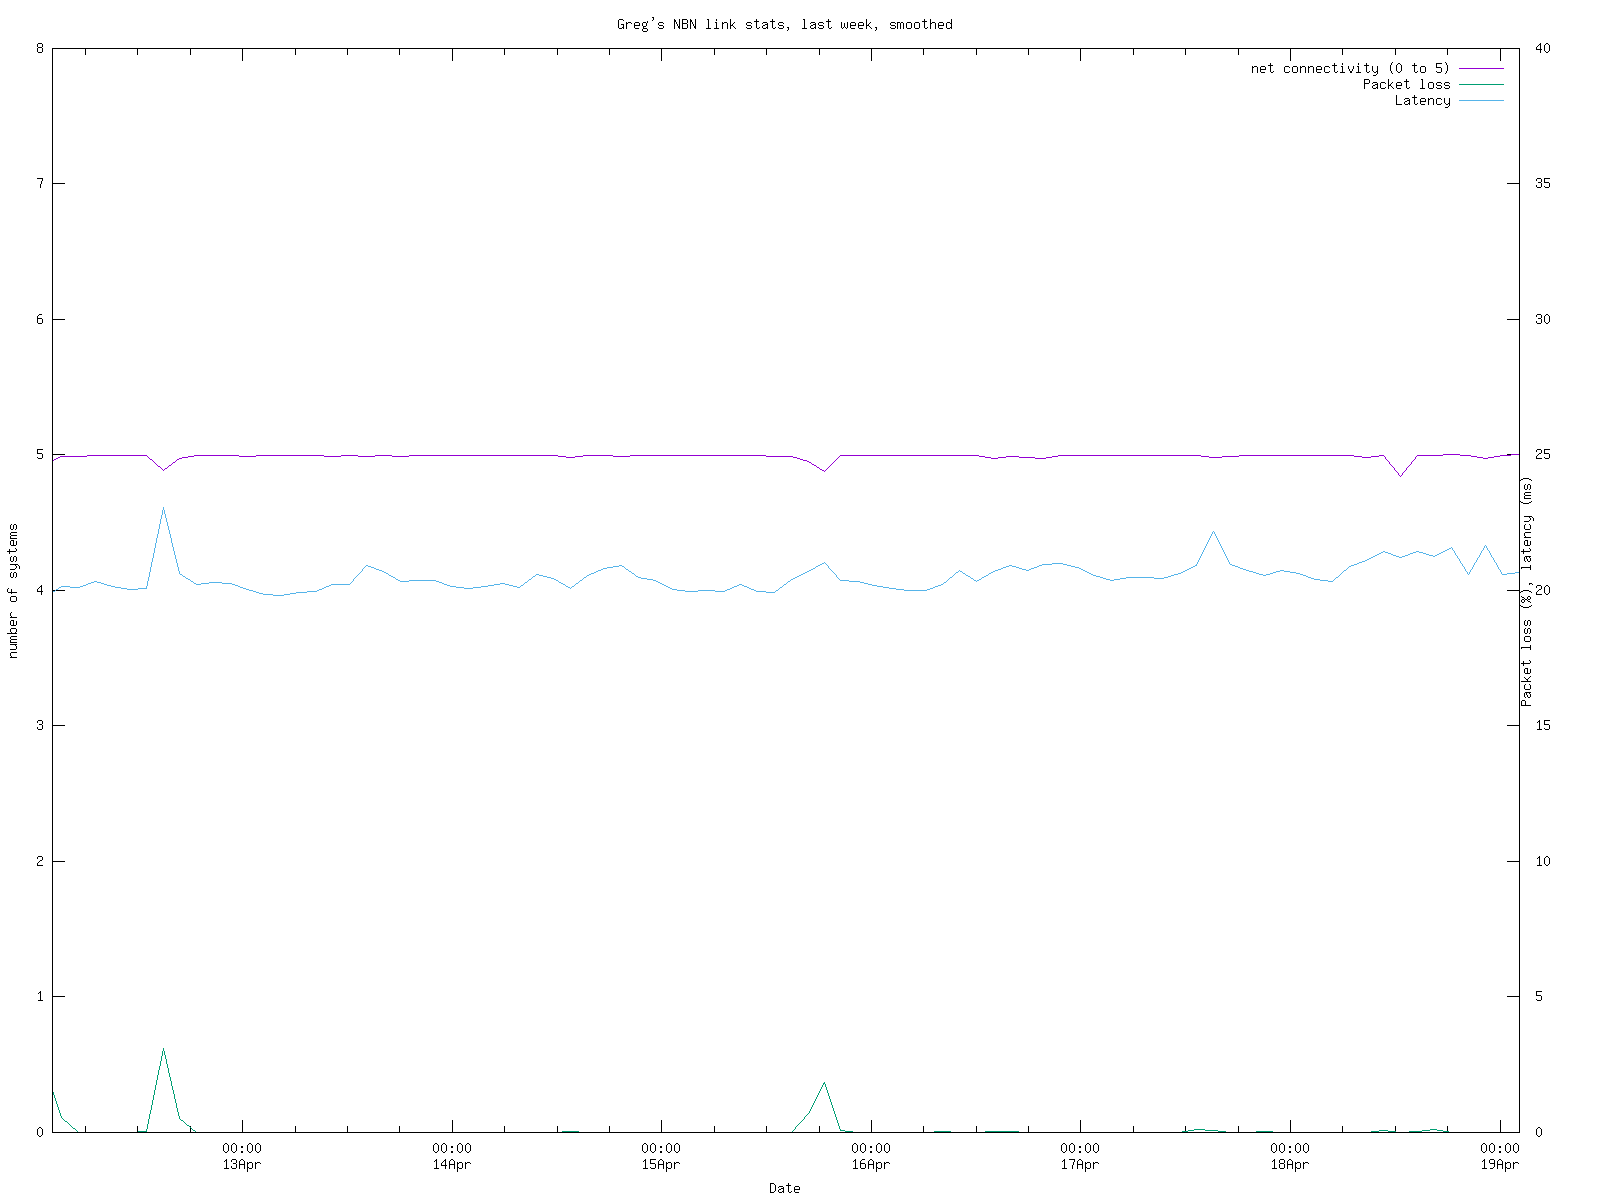
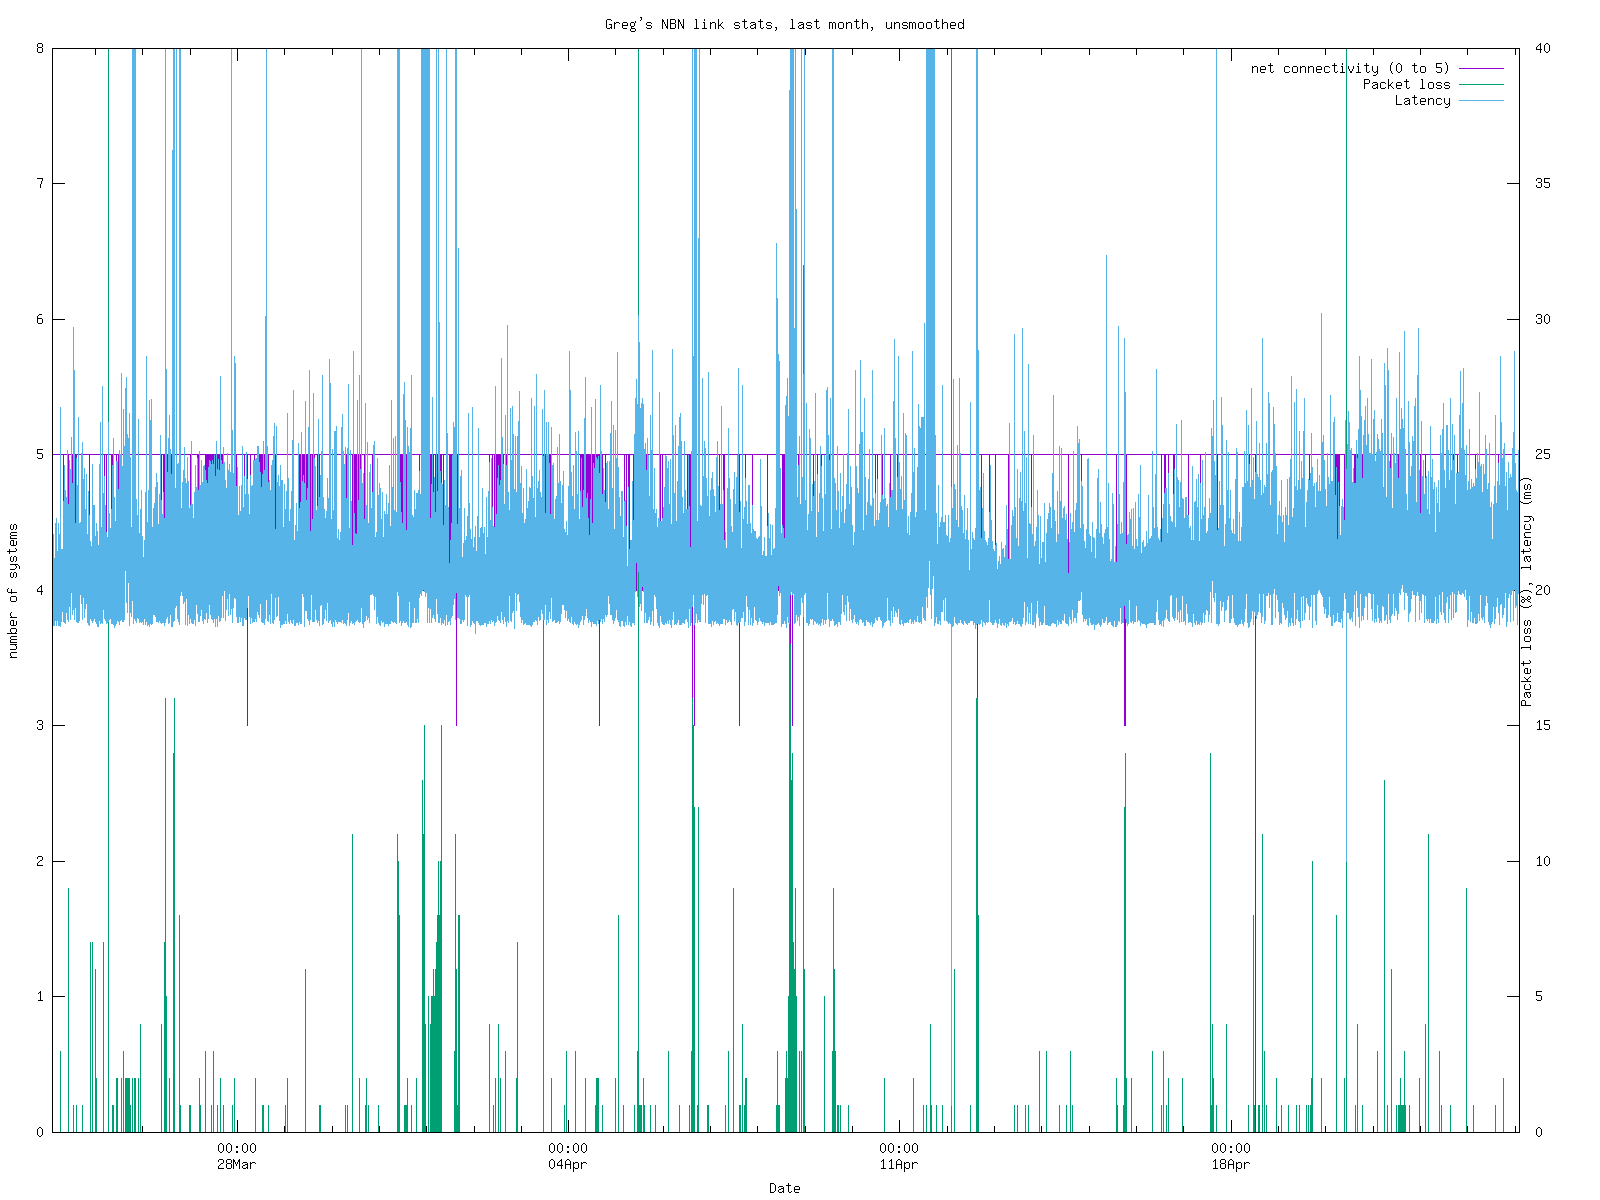
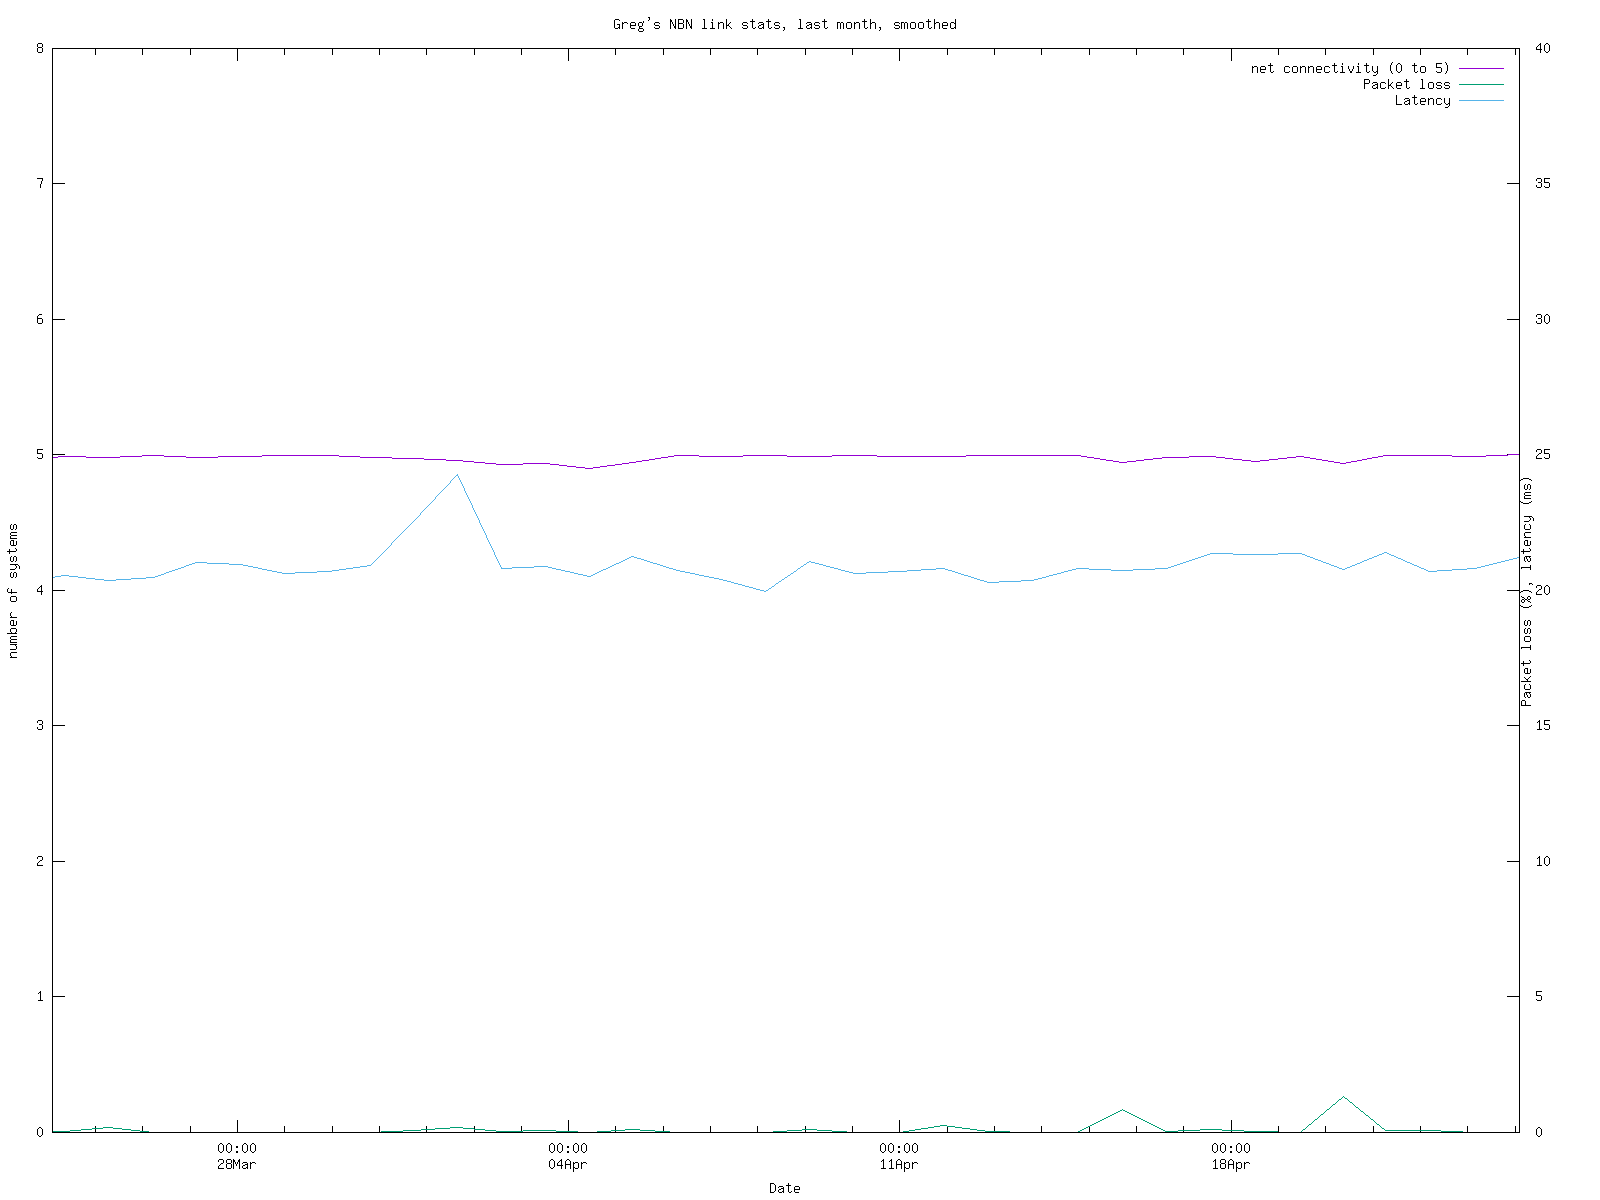
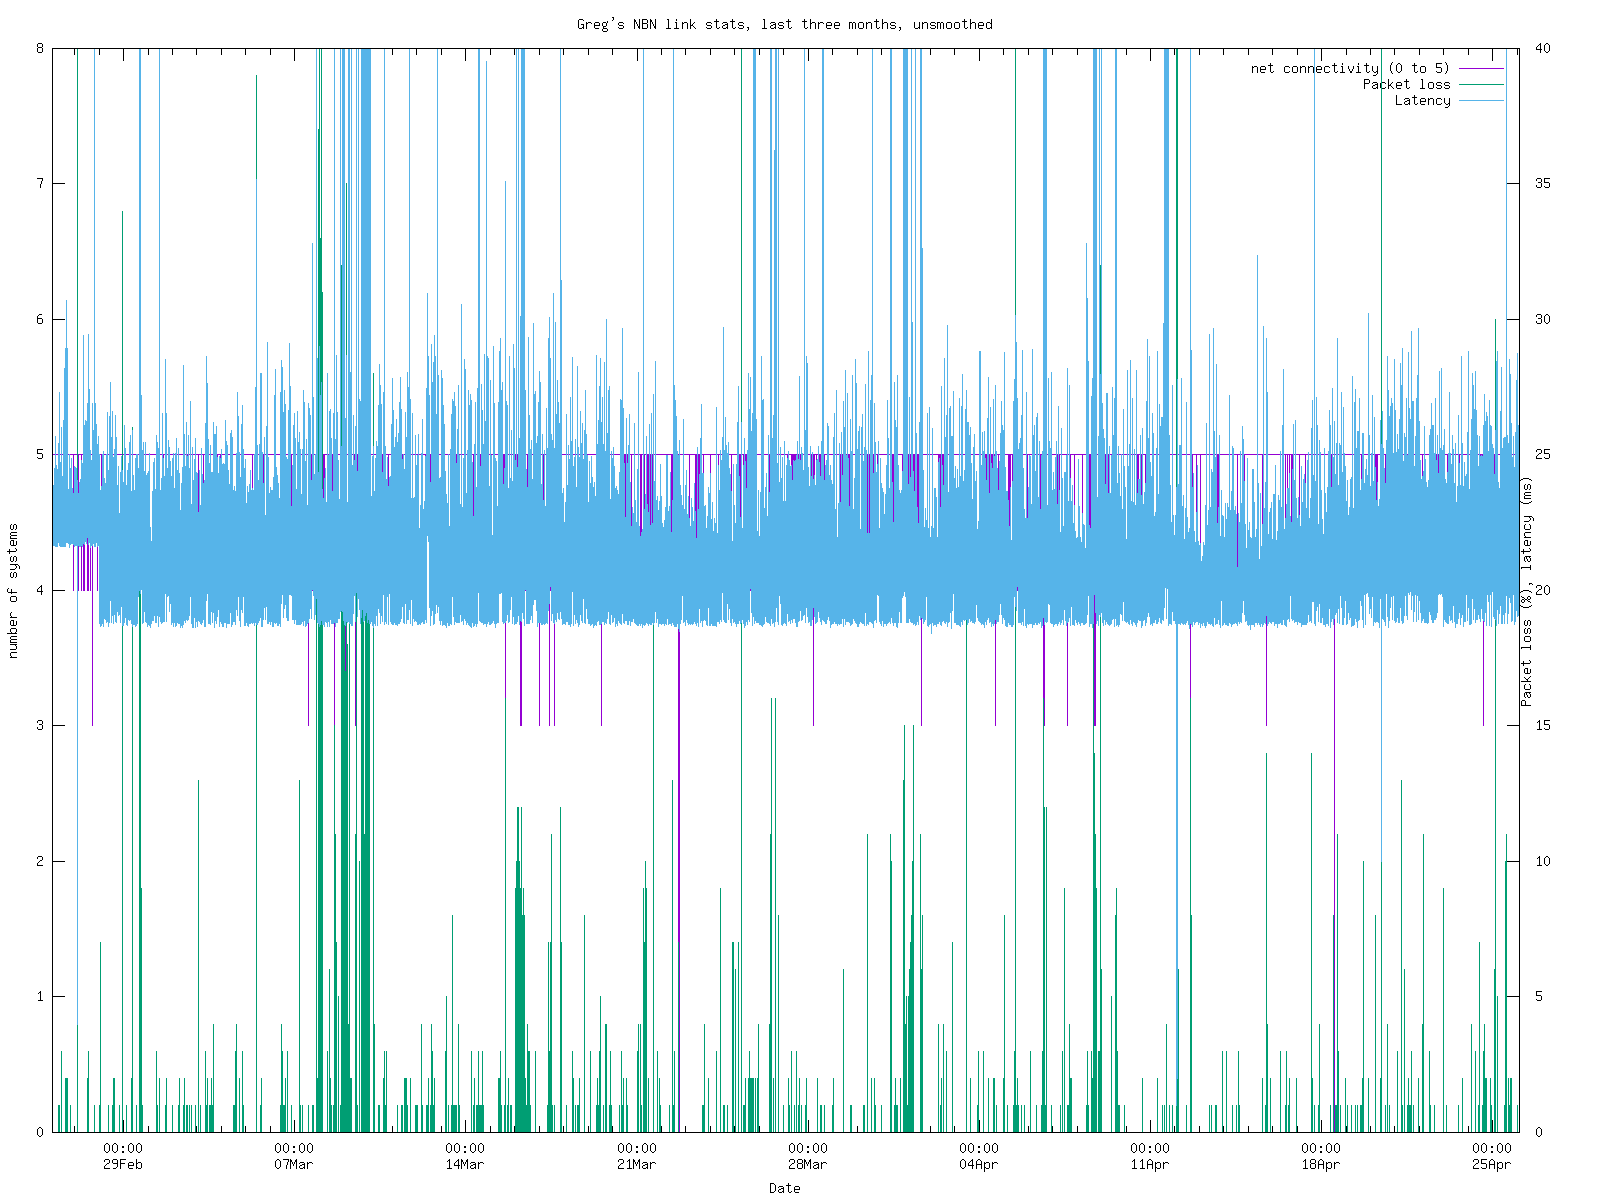
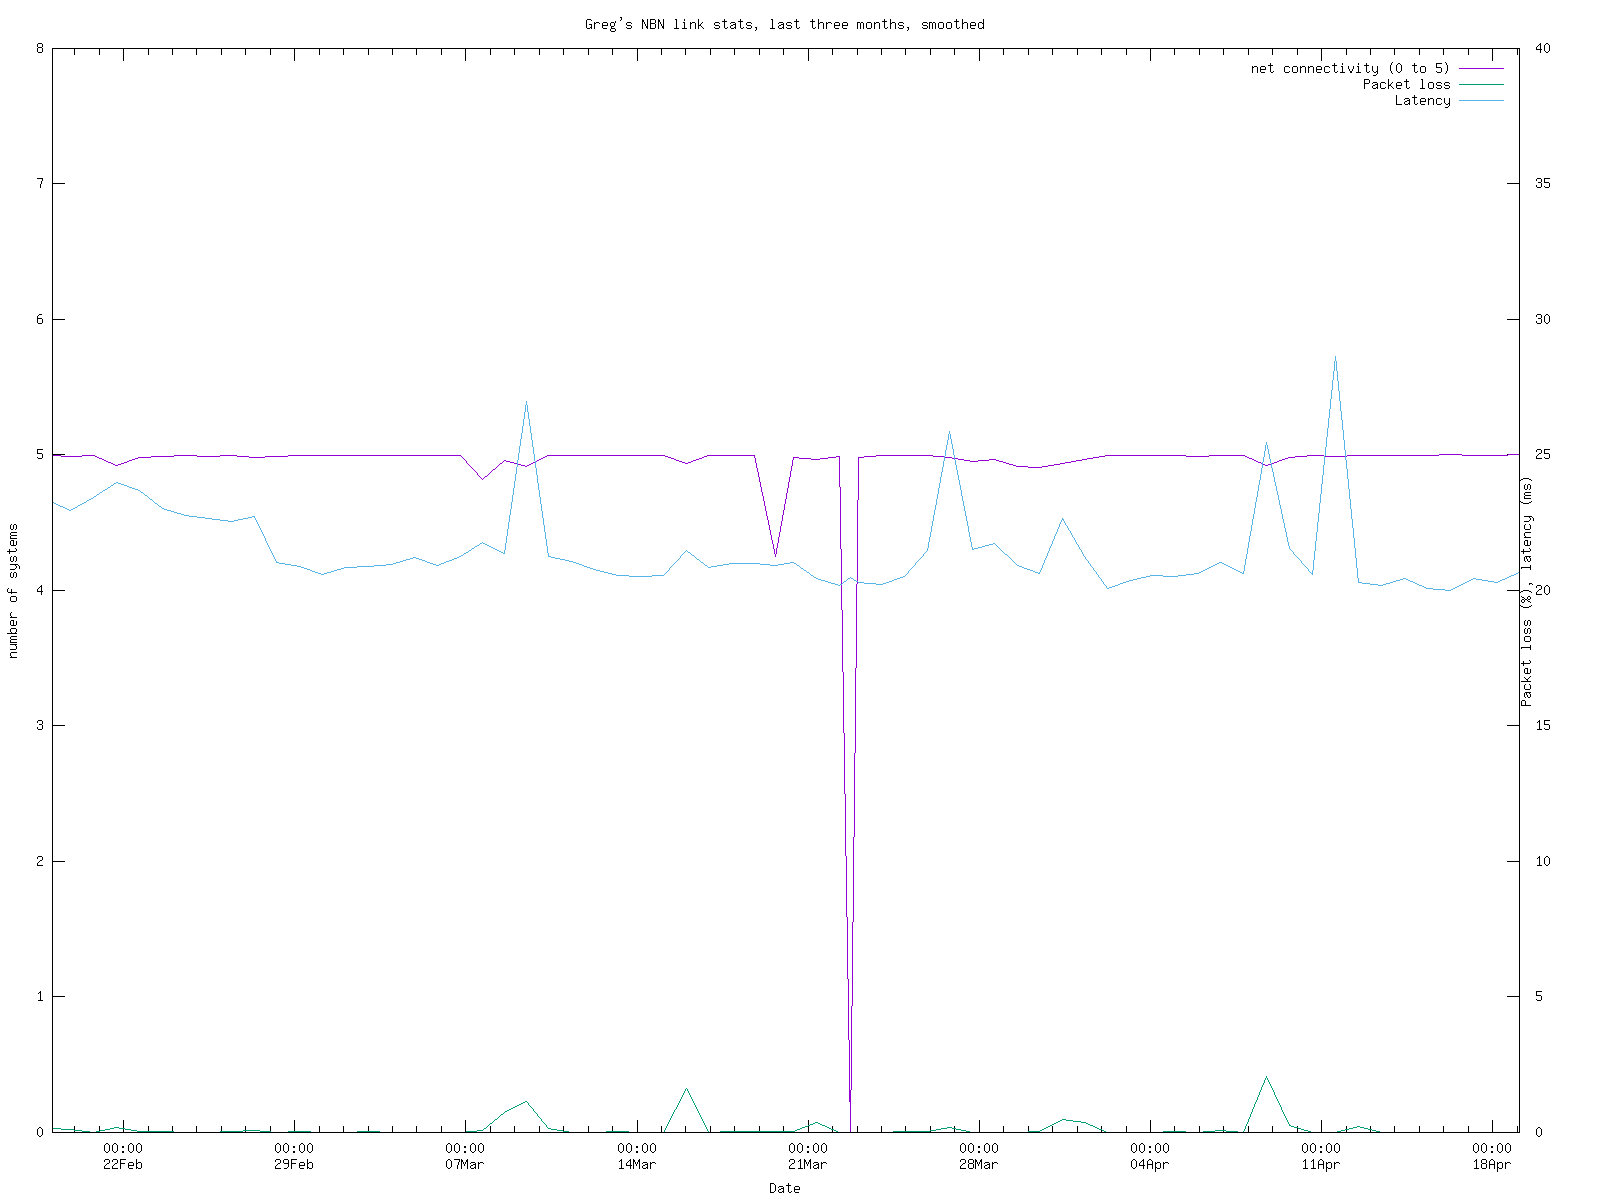
The graphs show:
Network status. This is the number of remote systems responding to a ICMP echo (ping) packet at the same time as the link status ping. I currently ping 5 systems which I frequently access: freefall.freebsd.org (now somewhere in New York state), www.lemis.com, my external web server in Raleigh NC, ffm.lemis.com, located in Frankfurt am Main, ozlabs.org, located in Canberra, and ftp.netbsd.org, located somewhere in the USA. Normally this value should be 5. If it's less, the script retries every second until full connectivity is restored.
Link packet loss, which has proven to be a significant issue since early 2018. I send 20 ICMP ping messages to the other end of the network link and count how many are lost.
I previously had parameters "link status" and "TCP speed”, but they no longer seem to make much sense.
The graphs were made with gnuplot, and I'm not very happy with the smoothing. In particular, the right-hand side of smoothed graphs has too much influence, and it's easy to get the false impression that the link status or TCP speed have changed significantly in the last few minutes. If anybody can point me at a way to fix this problem, I'd be grateful.
Click on the graphs for a 1600x1200 version.

This section monitors the NBN link for outages, including planned outages. I have manually edited the data to remove false positives, such as when moving house. I have a program that evaluates the outage information and produces detailed outage information. Here's the information on the past 20 outages, along with the overall statistics:
Start time End time  Duration   Badness        from                    to
                     (seconds)

1726109505 1726109741    236	  0.581	# 12 September 2024 12:51:45 12 September 2024 12:55:41
1726640464 1726641127    663	  0.007	# 18 September 2024 16:21:04 18 September 2024 16:32:07
1727736989 1727769767  32778	  0.003	#  1 October 2024 08:56:29  1 October 2024 18:02:47
1727822802 1727859511  36709	  0.068	#  2 October 2024 08:46:42  2 October 2024 18:58:31
1727912466 1727925795  13329	  0.068	#  3 October 2024 09:41:06  3 October 2024 13:23:15
1727933302 1727934073    771	  0.480	#  3 October 2024 15:28:22  3 October 2024 15:41:13
1727935277 1727935412    135	  2.990	#  3 October 2024 16:01:17  3 October 2024 16:03:32
1728306921 1728307059    138	  0.010	#  8 October 2024 00:15:21  8 October 2024 00:17:39
1730323926 1730352322  28396	  0.002	# 31 October 2024 08:32:06 31 October 2024 16:25:22
1730855658 1730855776    118	  0.007	#  6 November 2024 12:14:18  6 November 2024 12:16:16
1730855832 1730856433    601	 64.286	#  6 November 2024 12:17:12  6 November 2024 12:27:13
1730856734 1730857717    983	 11.960	#  6 November 2024 12:32:14  6 November 2024 12:48:37
1731394871 1731394874      3	  0.007	# 12 November 2024 18:01:11 12 November 2024 18:01:14
1732637415 1732637439     24	  0.003	# 27 November 2024 03:10:15 27 November 2024 03:10:39
1732639970 1732640162    192	  1.422	# 27 November 2024 03:52:50 27 November 2024 03:56:02
1732640289 1732641155    866	 28.346	# 27 November 2024 03:58:09 27 November 2024 04:12:35

Summary
Total 585 outages, total time 1334377 seconds (15 days, 10:39:37)
Longest outage:			192150 seconds (2 days, 05:22:30)
   Start:			21 February 2015 04:36:54
   End:				23 February 2015 09:59:24
Average time between outages:	586175 seconds (6 days, 18:49:35)
Average duration:		2280 seconds (00:38:00)
Availability:			99.61%
“Badness” is an attempt to quantify the effect. It's the reciprocal of the number of seconds per hour that the link was up between failures (i.e. 3600 / uptime).
And here is the summary information for the past 10 days with a less than 100% record:
Timestamp      Outages  Duration  Availability    Date
                        (seconds)
1726063200	  2	   440	 99.49%	# 12 September 2024
1726581600	  1	   663	 99.23%	# 18 September 2024
1727704800	  1	 32778	 62.06%	#  1 October 2024
1727791200	  1	 36709	 57.51%	#  2 October 2024
1727877600	  3	 14235	 83.52%	#  3 October 2024
1728306000	  1	   138	 99.84%	#  8 October 2024
1730293200	  1	 28396	 67.13%	# 31 October 2024
1730811600	  3	  1702	 98.03%	#  6 November 2024
1731330000	  1	     3	100.00%	# 12 November 2024
1732626000	  3	  1082	 98.75%	# 27 November 2024
The dates in the left columns are in UNIX time_t format to ease further processing. I also have lists of all individual outages, or summaries per day.
| Greg's home page | Greg's diary | Greg's photos | Copyright |