
| Greg's satellite link statistics |
|
||||||
|
|
|
|
|||||||||||
This is a historical document which was relevant between December 2007 and December 2010. The rest of this text hasn't been changed since then.
One of the less pleasant consequences of moving from Echunga to Dereel in July 2007 was that I lost my ADSL line and had to resort to other methods. After a disastrous attempt to use Telstra's NextG service, I got a satellite connection with IPStar in December 2007. In December 2010, I changed to a 3G service, for which I'm maintaining a separate page. This page shows the status of the satellite link as of 29 December 2010, a couple of days after I stopped gathering statistics.
It would be nice to say that IPStar works well, but it's not that easy. Communications satellites are in a geostationary orbit 36,000 km above the equator, so connections have an additional built-in 480 ms latency on a round trip (144,000 km at the speed of light). But the ping times I had with IPStar were up to 2 seconds, which can't be explained by the technology. In addition, the connection continually dropped out—the average time between dropouts was less than 24 hours, and the average dropout time was about 13 minutes per day.
In March 2010 things briefly got better. The average ping time dropped from round 2 seconds to just under 1 second, and between 18 March and 6 April there were no outages. Unfortunately, that was an exception; after that, it reverted to the old pattern. On 8 May 2010 my connection was moved to SkyMesh, which so far has shown no improvement.
This page bases on an earlier page that I wrote for the DSL connection. Currently it shows only connectivity, since the iCON IPX-3200 satellite modem I'm using has some of the most broken firmware I've seen anywhere—it works only in conjunction with Microsoft's “Internet Explorer”.
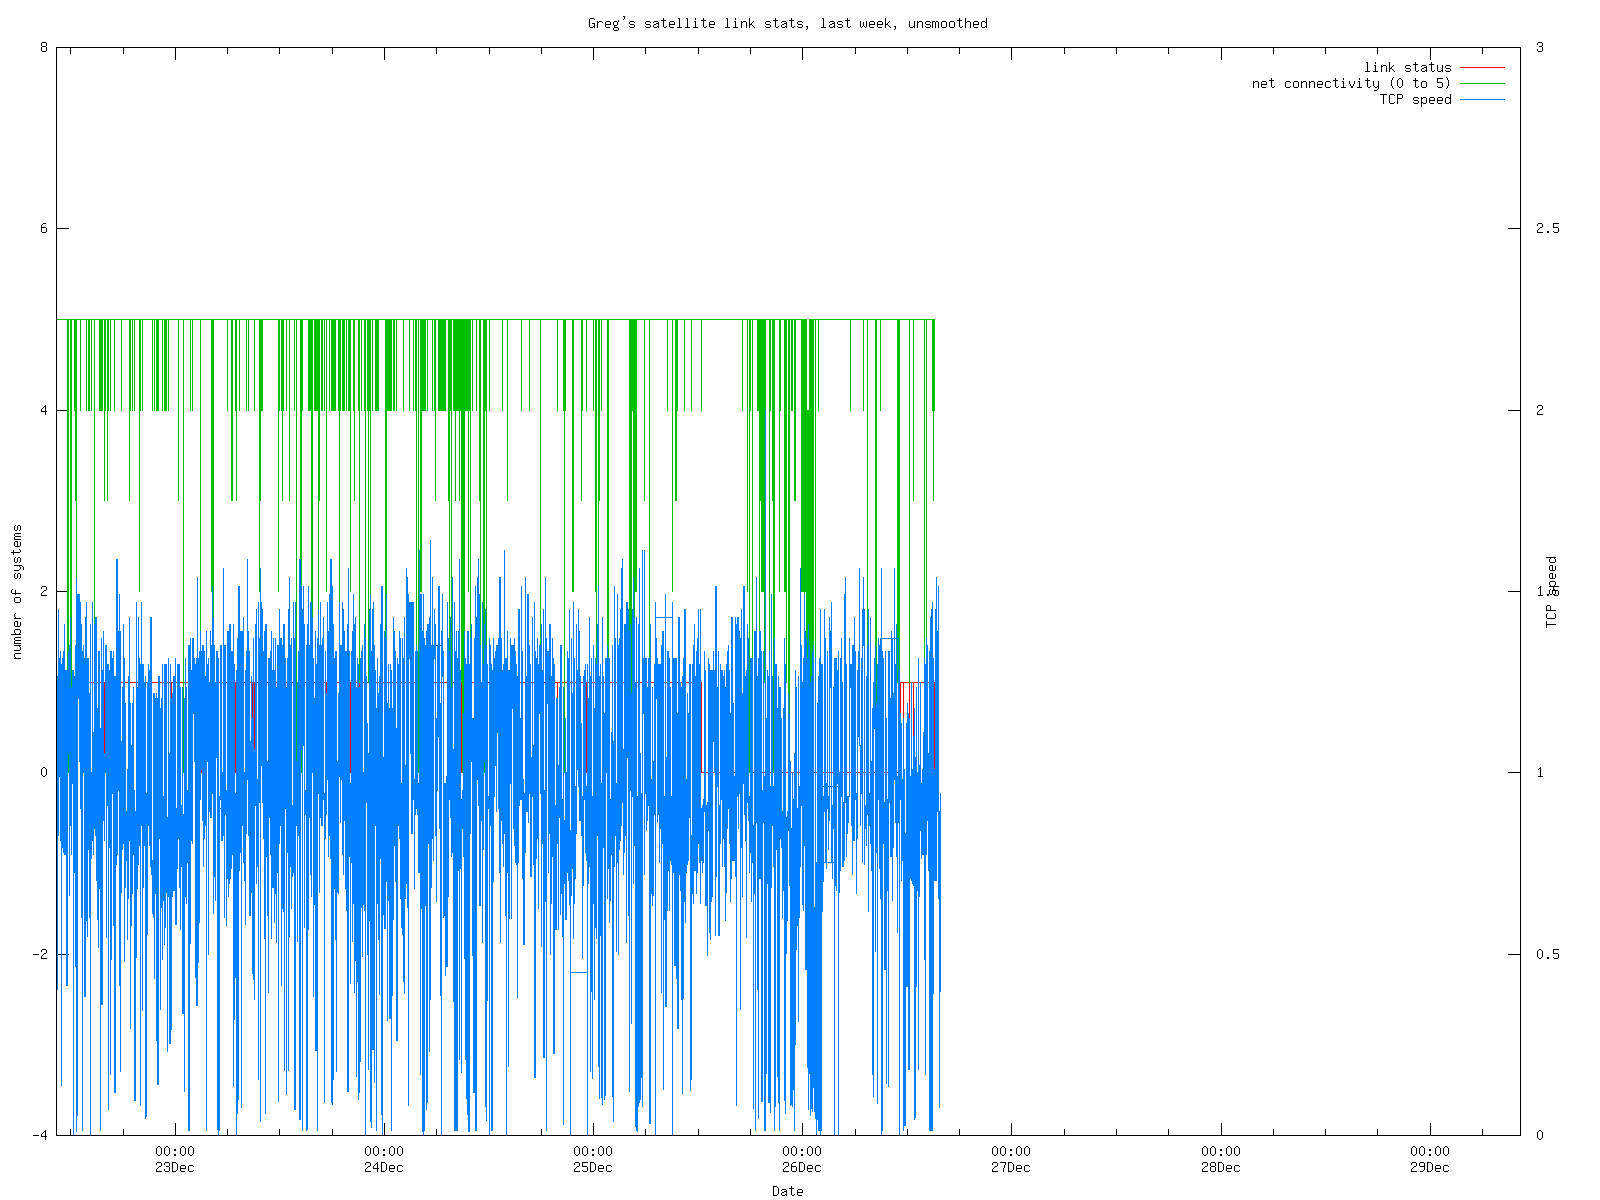
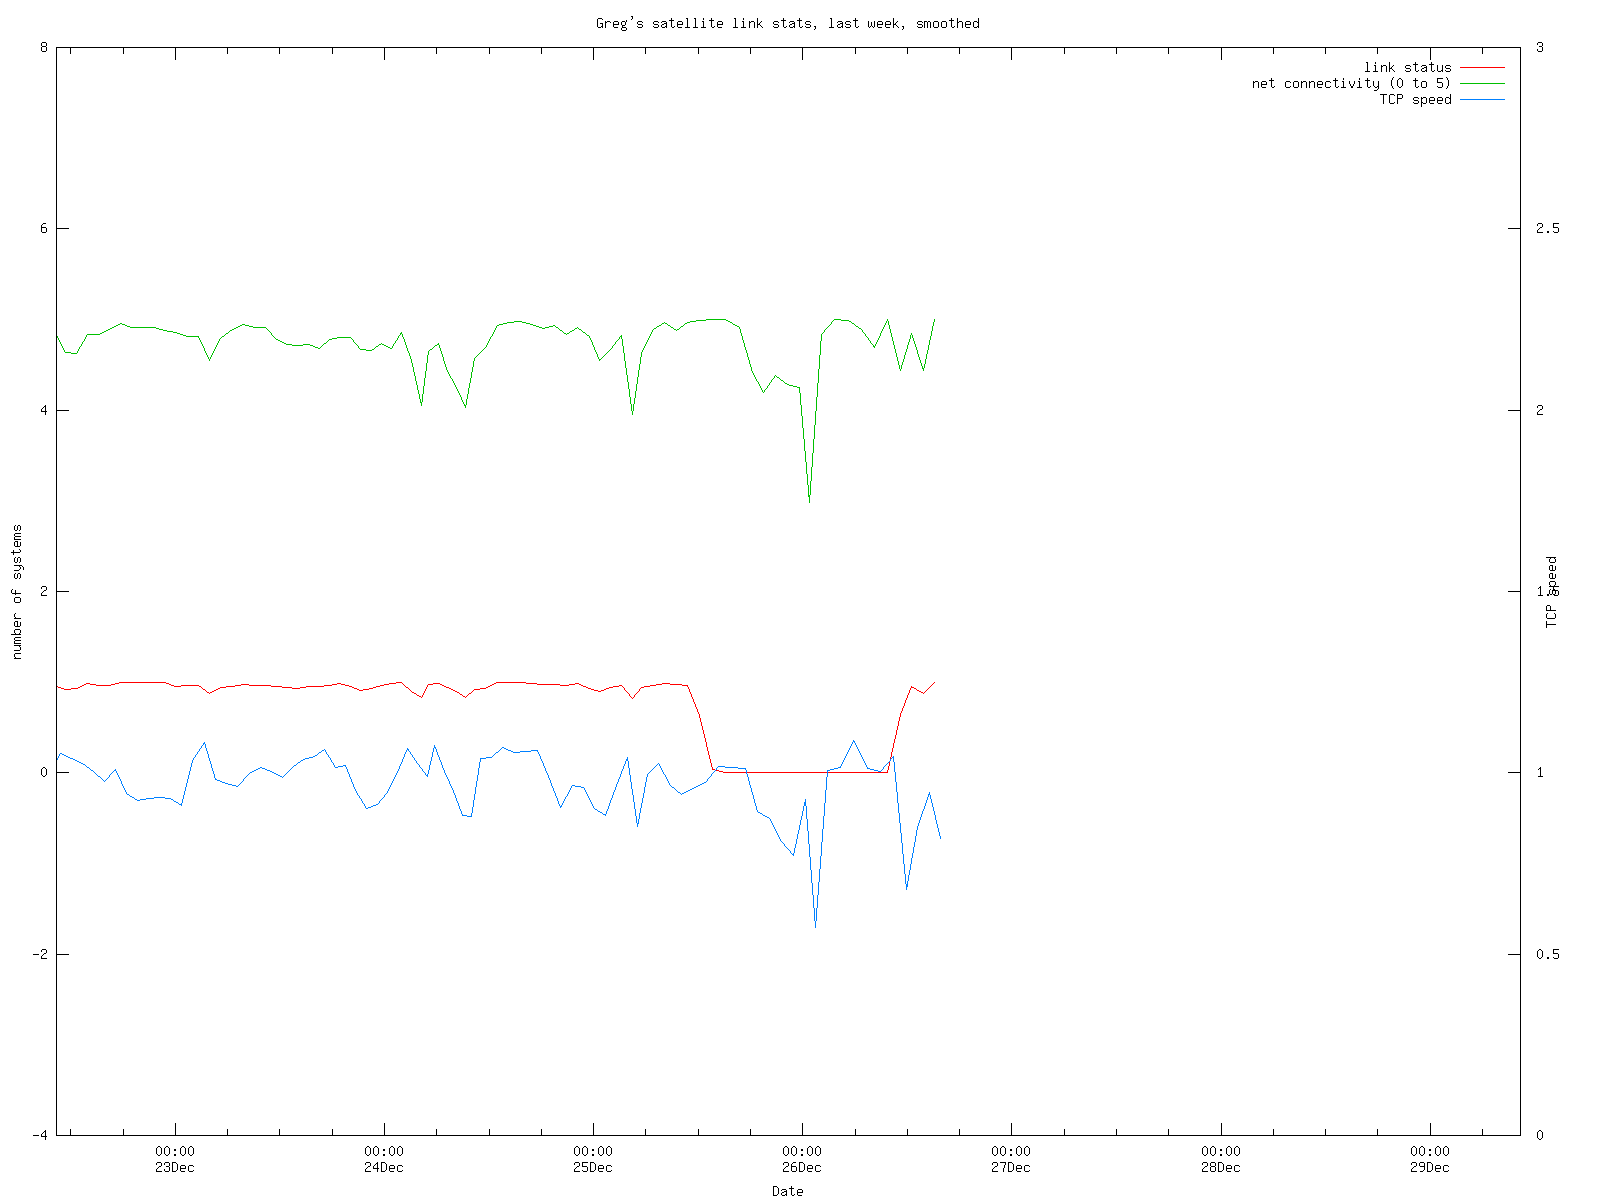
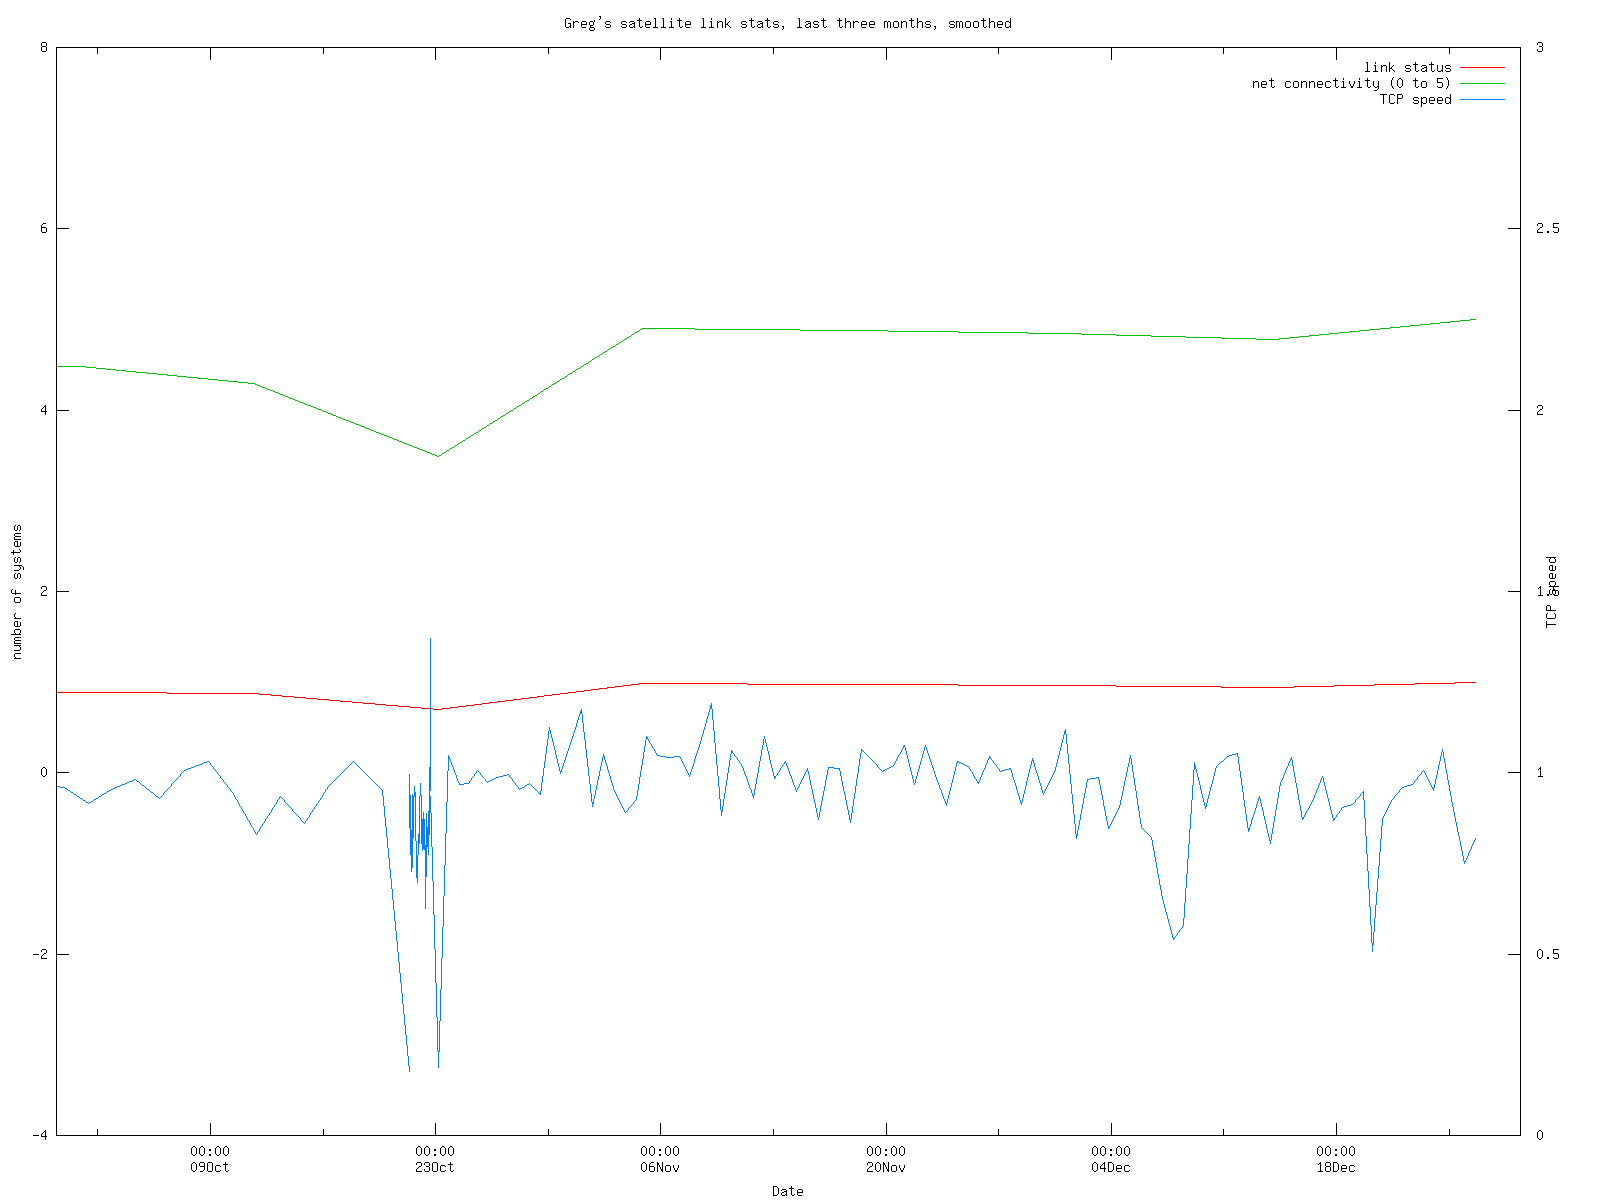
The graphs show:
The network status shown in green does not indicate anything about the TCP problem: they're pings, which use ICMP. Anything less than 100% indicates problems beyond the TCP issue. I've only just started to address the TCP issue, and things may change. The current plots (in blue) are a reciprocal function of the time it takes to transfer a very small “web page” (four bytes) from my external web server. The values shown are reciprocal seconds: 0.5 is 2 seconds, 2 is 0.5 seconds, etc. Before the “repair” to the service, the transfer took about 2 seconds (speed 0.5), and afterwards it's closer to 1 second (speed 1).
This graph doesn't directly show the loss of TCP connectivity: as long as the “speed” is above 0, I have connectivity. When the connectivity goes away, the “speed” drops to 0.
Click on the graphs for a 1600x1200 version.

Apart from the graphs above, I also have a program that evaluates the outage information and produces detailed outage information. Here's the information on the past 10 outages, along with the overall statistics:
Start time End time  Duration   Badness        from                    to
                     (seconds)
1293285815 1293285855     40	  4.523	# 26 December 2010 01:03:35 26 December 2010 01:04:15
1293286678 1293286729     51	  4.374	# 26 December 2010 01:17:58 26 December 2010 01:18:49
1293287381 1293287428     47	  5.521	# 26 December 2010 01:29:41 26 December 2010 01:30:28
1293287815 1293287929    114	  9.302	# 26 December 2010 01:36:55 26 December 2010 01:38:49
1293288603 1293288686     83	  5.341	# 26 December 2010 01:50:03 26 December 2010 01:51:26
1293289494 1293289618    124	  4.455	# 26 December 2010 02:04:54 26 December 2010 02:06:58
1293314666 1293314779    113	  0.144	# 26 December 2010 09:04:26 26 December 2010 09:06:19
1293324413 1293324441     28	  0.374	# 26 December 2010 11:46:53 26 December 2010 11:47:21
1293334523 1293334581     58	  0.357	# 26 December 2010 14:35:23 26 December 2010 14:36:21
1293335367 1293335528    161	  4.580	# 26 December 2010 14:49:27 26 December 2010 14:52:08

Total 1684 outages, total time 792001 seconds (9 days, 04:00:01)
Average time between outages:	56449 seconds (15:40:49)
Average duration:		470 seconds (00:07:50)
Availability:			99.17%
“Badness” is an attempt to quantify the effect. It's the reciprocal of the number of seconds per hour that the link was up between failures (i.e. 3600 / uptime).
And here is the summary information for the past 10 days with a less than 100% record:
Date        Outages   Duration  Availability    Date
                      (seconds)
1292504400	 30	  2517	 97.09%	# 17 December 2010
1292590800	 19	  1806	 97.91%	# 18 December 2010
1292677200	 32	  3056	 96.46%	# 19 December 2010
1292763600	 23	  1598	 98.15%	# 20 December 2010
1292850000	 16	  1628	 98.12%	# 21 December 2010
1292936400	  7	   459	 99.47%	# 22 December 2010
1293022800	  7	   626	 99.28%	# 23 December 2010
1293109200	 15	  1312	 98.48%	# 24 December 2010
1293195600	  9	   926	 98.93%	# 25 December 2010
1293282000	 11	   856	 99.01%	# 26 December 2010
The dates in the left columns are in UNIX time_t format to ease further processing. I also have lists of all individual outages, or summaries per day. Be warned: they're large.
The scripts that do this monitoring are:
My scripts are very much tailored towards my own usage, so you probably won't want to run them like that. I've prepared a generic version which runs on FreeBSD, Linux and Mac OS X. I'd be very interested to hear what results other IPStar users get. More details here.
I'm not the only person suffering from IPStar's unreliability. There's a thread on Whirlpool that handles it too. Some of the interesting details I've found there:
| Greg's home page | Greg's diary | Greg's photos | Copyright |