| Greg's Fine Offset WH-1080 weather station |
|
|||||||||
In August 2009 I bought a Fine Offset WH-1081 weather station. The base model is WH-1080, and it includes a time signal receiver. There's no support for that in Australia, so the somewhat cheaper WH-1081 omits the receiver. In this article I'll refer to it as “WH-1080”.
The WH-1080 was widely available in Australia from a number of different locations and under multiple names, for example Jaycar (currently $199 + postage), or eBay (prices from about $120 including postage). The photo below is the best guide to see if the station you're looking at is a WH-1080.
I've also recently seen a station on sale at similar prices called a WH-1091. I have no experience of it, but from the number and the external unit, it appears that it's made by the same company. I've been told that the same software works on it, but it remains to be proven if that applies to my software too.
The WH-1080 consists of two parts: an indoor unit which connects to the computer, and the outdoor unit which collects the bulk of the readings.
The inside unit has a display with all parameters, along with a forecast image showing images of rain, clouds or sun. All home weather stations seem to do this, and sometimes the forecast is correct. Communication with the unit is via touch screen, which makes the contrast very poor. It interfaces to the computer via USB interface, and to the external unit via wireless. It also measures barometric pressure, internal temperature and humidity:

|
|||||||||||||||||||||||
At top left are the interior and exterior temperatures and relative humidities. Top right is wind speed shown graphically and numerically (5.0 km/h) and rainfall (0). Centre left is an attempt at a weather forecast (rainfall in this case). Centre right is the barometric pressure (this device is has a defective display) and a toy relative pressure bar chart below. At the bottom are time, date, and an indicator showing how much memory is in use.
The external unit is designed for mounting on a pole:

|
|||||||||||||||||||||||
Click on the photo for progressively larger versions. This photo shows the temperature sensor at the left, which also contains the transmitter. To the right are, in sequence, weather speed detector behind, the weather vane and the rain gauge. All are connected with the ridiculously long cables supplied with the unit.
The unit comes with software called “Easyweather”, which runs on Microsoft only. I've installed it and played with it, and if that's all you want, it's there. But I find it limited, and I don't want to run a Microsoft box all the time. There isn't much free software for it out there—I got some patches for wview, but they applied to an old version of wview, and I found the wview software so unstable that I couldn't be bothered with it. Ultimately I wrote my own software, but it's not yet really complete, and at least for that reason I haven't got round to documenting it. When I do, it'll be available here.
The WH-1080 is not a very reliable unit. All users I've spoken to report that it occasionally reports completely spurious information—for example, temperatures of -200°, or air pressures of 3200 hPa. This appears to be in the interface between the internal unit and the computer, and much of the code that others and I have written attempts to detect these errors. My code reads the data twice, for example, and doesn't give up until it get the same thing twice. I think I now have it at a point where it no longer reports incorrect information.
In my experience, the rain gauge seems particularly inaccurate. I also have a manual rain gauge, and the WH-1080 can vary by up to 50% in either direction. They're 50 m apart, though, and it's not clear what difference that makes. But I've heard of wind influencing the readings (causing the buckets to empty before they're full, and thus overread) and I've experienced spiders building webs in the unit, gumming up the buckets and dramatically reducing the reading. Here the rain gauge with the lid off, first clean, then full of spiders webs. The bucket fills up with the equivalent of 0.3 mm rain (thus the minimum it can report) and tips the two buckets back and forth like a see-saw:

|
|||||||||||||||||||||||

|
|||||||||||||||||||||||
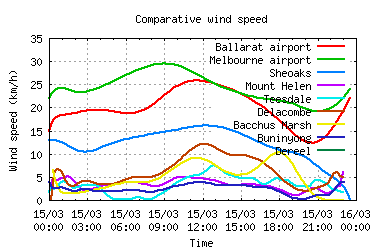
I'm also not convinced about the wind readings; they seem so much lower than elsewhere, as the weather comparison page shows (my location is Dereel):

I don't know any independent way to measure the wind speed, though, so maybe it's correct.
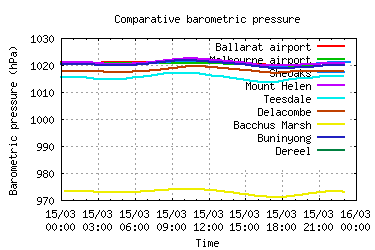
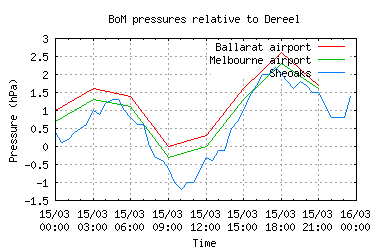
The barometer is also inaccurate; on mine it typically registers 14 to 15 hPa too low. You can compensate for this on the display by setting a different height above sea level (the reading is a “mean sea level” reading), and in my software I include a compensation factor. Barometric pressures are frequently incorrect, as my comparison pages show (first image), but in general mine now comes quite close to the Bureau of Meteorolgy sites at Ballara airport, Melbourne airport and Sheoaks:


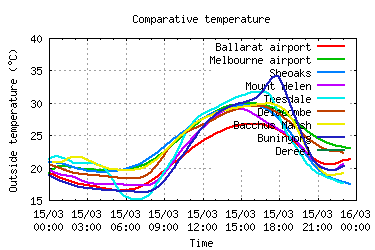
On the positive side, the temperature measurements seem to be correct. At first, I thought that it was reading too high: in general, it shows several degrees higher than in Ballarat, and frequently higher than elsewhere in the area:

This proves to be correct, it seems: I have two other thermometers around the house, and they're in good agreement with the measurements. It is usually warmer here.
I initially spent some time getting the unit to work with wview, for which I received a patch for an old version. I had lots of trouble with wview, and when the power company damaged the unit in November, I started writing my own code.
The software is written in C (of course!), accesses the USB hardware with libusb, whatever that may be (there appear to be at least 3 different incompatible ones, and it's not the current version described on the libusb project home page). I store readings in a MySQL database, use gnuplot to generate the images, and display it on web pages using PHP and Apache. If it weren't for the fact that it runs on FreeBSD, it would be a typical LAMP application.
I wrote the software mainly in November 2009, and I've taken a break after getting the displays working for a day at a time. At present (17 March 2010) I'm thinking about how to lessen the current extreme pain of adding additional graphs to the display.
Until I have written a proper description of the software, you can read my diary entries on the subject.
| Greg's home page | Greg's diary | Greg's photos | Copyright |